How to Read Crypto Price Charts: A Beginner's Walk Through the Basics
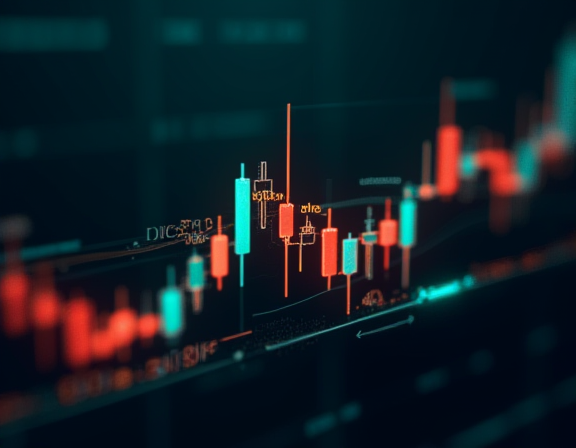
A single candlestick records the price story of one interval of time: the open is the trade price at the start of that interval; the close is the trade price at the end; the high and low are the extremes touched along the way. Drawing those four numbers as one candle, the two ends of the body mark the open and close, and the thin lines above and below — the wicks — mark the high and low that were tagged but not held.
One of the biggest differences between crypto markets and traditional stock markets is that crypto never closes: you choose whether each candle represents one minute, five minutes, one hour, one day, or one week. The same span of price action tells a different story depending on the timeframe you pick — something to settle in your head before you look at any chart.
Start with one candle
By convention, when the close is above the open the candle is drawn green (or hollow), meaning bulls won that interval; when the close is below the open, it is drawn red (or filled), meaning bears won. A heads-up: A-share and HK markets use the opposite colors of crypto and US markets, so always confirm the palette before reading.
The length of the body tells you how lopsided the interval was: a long body means one side pressed hard; a very short body, or a near-flat line (a doji), shows both sides fought to a draw and the price returned near the open.
The wicks reveal emotion:
- Long upper wick: price punched higher and got slapped back, signaling pressure above.
- Long lower wick: price plunged and was bought up, signaling demand below.
- Small body with long wicks on both sides: both sides tried, neither succeeded; the market is tugging.
These are just signals from one candle. The point is not memorizing pattern names — it is translating the candle into “who was urgent, who was steady” during that window.
Place each candle inside a trend
A candle in isolation says almost nothing; it has to sit inside a trend to mean anything. Trends fall into three rough buckets:
- Uptrend: the chart drifts to the upper right; each pullback’s low is higher than the last, each rebound’s high is higher than the last.
- Downtrend: the mirror image — lower highs and lower lows.
- Range / consolidation: highs and lows oscillate inside a band with no clear direction.
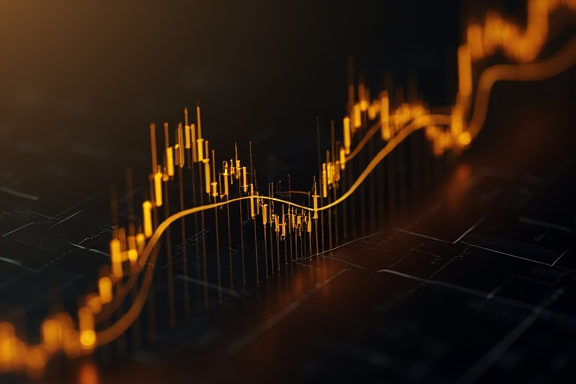
The simplest tool for reading trend is the moving average — say a 20-day or 50-day line, which averages closing prices and draws them as a curve. When price stays above the average, bulls dominate; when price keeps slicing through and reclaiming, you are in a range.
The first habit of chart reading is to look at trend before you look at the candle. A long red candle inside an uptrend reads completely differently from one inside a downtrend: the first may be a healthy pullback, the second may be the trend accelerating downward.
Do not skip the bars under the chart
Many beginners stare only at candles and ignore the row of bars below — volume. Volume is the number of contracts or coins changing hands in the same interval, and it tells you how many people are actually behind this move.
- Rising price on expanding volume: real money pushing, the trend is on firmer ground.
- Rising price on shrinking volume: nobody is taking the baton, prone to pullback.
- Falling price on expanding volume: panic or active selling, the down move may continue.
- Falling price on shrinking volume: sellers are exhausted, the downside is losing energy.
Volume is the best translator a candle has. A fierce-looking green candle on tiny volume is often just a gust where the air is thin. Understanding volume is also part of basic risk management — you want to know whether you are buying a trend or a candle conjured by a few players.
A few patterns you will hear constantly
In technical analysis, a pattern is a recurring shape drawn by candles and trend together. Three you will see beginners mention most:
Double bottom (W): price falls to a level, bounces, falls back near the same level, and bounces again. The two lows connected look like the letter W and are considered a potential reversal — the market probed the same floor twice and failed to break through, suggesting support there.
Head and shoulders top (flip it for the bottom version): price prints a high (left shoulder), pulls back, then prints a higher high (head), pulls back, then can only print a high a bit below the head (right shoulder). Three peaks shaping a “head between two shoulders,” widely read as an uptrend losing steam.
Breakout: price oscillates inside a range for a long time, then with volume punches above the upper edge or below the lower edge, often marking the start of a new trend. The “with volume” part matters — a breakout without volume is often a fake.
The most effective way to actually learn these patterns is not to memorize names but to scan history with a hypothesis: on a coin you know, look at the past year’s chart, point at the spots that you think look like a double bottom or a head and shoulders, then read what really happened next. Most of the time you will find that patterns confirm far less often than you assumed — and that is exactly the lesson beginners need. Translate “long upper wick” into “someone is selling up here,” “long lower wick” into “someone is buying down here,” and “range break on volume” into “someone is actually betting on this,” and those intuitions outlast any pattern name.
A chart is data, not a crystal ball
The last point matters most for beginners: every chart pattern is probabilistic, and no candle arrangement guarantees what the next candle will do. When you read “a double bottom must rally” or “a head and shoulders must crash,” discount it mentally. The chart can only show you history; the next move is decided by countless trades that have not happened yet.
The real use of reading a chart is to choose between two reasonable explanations — is this pullback healthy or the start of a top? Is this rally backed by volume or a paper tower? Not to forecast what a coin will print three days from now. Used alongside position sizing and stop-loss rules, technical analysis becomes a tool; staring at charts alone is closer to reading tea leaves.
This article is educational and does not constitute investment advice. Markets are uncertain; make decisions in line with your own risk tolerance.
This article is for education only and is not financial advice. Crypto is volatile and risky — only ever risk what you can afford to lose.